Back to Homepage of Anne Boomsma
Data Files for the R Tutorial
Internet Sites on R
Place and time
Place: Faculté des Hautes Etudes Commerciales, Université de
Lausanne.
Date: June 10–13, 2013
Lectures and exercises: 13.00 – 17.30 hours in room 261 (Internef building, Fame lab)
Enrollment
The course is offered to students of the Faculté des Hautes Etudes Commerciales (HEC), Université de Lausanne. Participants are requisted to register for the course (until June 1) via Moodle, using
their e-mail login and enrollment code ("clef d'inscription")
phd2013.
Objectives
This four-afternoons short course gives an introduction to the use of R, a software environment for statistical computing and graphics. The basics of R are taught so as to get students started with their own applied statistical problems. The course combines theoretical and practical work: after theoretical sessions with ample illustrations, students are invited to make specific exercises, apply statistical and graphical R functions to their own data sets, and even write their own functions in R. The tutorial and exercises are intended to take away any potential hesitation to use the R program, and to try and convince students of its widespread practical utility.
In general, it will take some efforts to go through first stages of unfamiliarity and programming discomfort perhaps, but in the end it certainly pays off to be in full control of statistical analysis and graphical display of results, and to diverge from unthoughtful mouse-clicking practices to the benefit of research quality.
Prerequisites
Working knowledge of basic statistics, regression analysis or the general linear model.
Practical recommendations
Students are encouraged to use their own data sets for analysis with R software, requiring a clear research problem formulation to start with. It is also recommended that they bring their own laptops; if they don't have one, they could use UNIL computers.
Preliminary outline
1. Introduction to R
– R language features
– R objects, functions in particular
– Data structures
– Data input and output
– Missing data
2. Descriptive statistics and graphical data display
– Graphical exposition of frequency distributions
– Summary statistics for single-sample and grouped data
– Descriptives for tables
– Robust statistics using Wilcox's functions
– Outlier detection
3. Null hypothesis significance testing
– Student's t- and other parametric tests
– Nonparametric hypothesis tests
– Association and correlation
– Power calculations and sample size determination
4. The linear model
– Linear regression analysis
– Analysis of variance
– Analysis of covariance
– Logistic regression
– Inspection of residuals, checking model assumptions
5. Structural equation modeling (optional)
– The lavaan package
6. Probability distributions and random sampling
– Discrete and continuous distributions
– Simulating random numbers and random sampling
– Bootstrap estimation procedures
7. Programming in R
– Writing your own functions
– Basic programming: conditional execution and loops
– Programming with functions
– Input and output control of functions
8. Monte Carlo experimentation
– Robustness questions and Monte Carlo experimentation
– A case study of Monte Carlo simulation
– Programming your own Monte Carlo study
Recommended literature
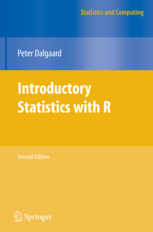
There will be eight theoretical lectures of two hours with illustrations, followed by two hours of supervised practical work. An accompanying document of the R tutorial – with exercises – will be made available before the course starts. The book shown at the top of this page is from the following list of references.
Software
In the lectures and during practical work the R software will be used, an open source environment for statistical computing. For a general introduction we refer to The R Project for Statistical Computing, providing further guidance and references.
Evaluation and exam
The course does not impose an exam. The students' evaluation of the course is informal.
Questions and
remarks
Students should feel free to contact the lecturer by e-mail, a.boomsma@rug.nl, or otherwise.